
This is an older version of the TFIR Retirement Plan Choice Modeling site
Please use the current page:
https://senate.universityofcalifornia.edu/resources/retirement-choice-model.html
© David Brownstone, Jim Chalfant, and Dan Hare
Updated December 7, 2022
The models described here are only valid for UC employees hired after July 1, 2016 with no prior UC service.
This webpage describes modeling work performed by TFIR members to assist new employees in choosing the type of primary UC pension they will get. Neither UC nor UCRP have participated in the modeling work. This webpage is intended to supplement the information on the UC Retirement Choice website, and you should definitely pay close attention to that resource before reading this document. The models and results presented here are not endorsed nor verified for accuracy by UCOP, Fidelity, or the UC Academic Senate. For purposes of providing benefits information, this webpage and modeler have not been authorized by the Board of Regents. The authors are members of the UC Academic Senate Task Force on Investments and Retirements (TFIR). Neither UC nor the authors guarantee the accuracy or suitability of these models, but we have independently checked the key calculations in both R and Excel. The modeling is best described as a tool for learning how the Pension Choice and Savings Choice options are structured, how they compare to each other, and how various assumptions affect projected outcomes between the options.
New employees hired at UC on or after July 1, 2016, must choose between a pure defined contribution plan (“Savings”) and a hybrid plan with a guaranteed pension plus a tax-advantaged savings plan (“Pension”). Once an employee chooses the Pension plan the choice is irrevocable, and this choice must be made within 90 days of initial hire at UC.[1] However, if an employee initially chooses the Savings plan she will have a one-time option (between 5- 10 years of service) to switch to the Pension plan. This document will refer to this option as “Second Choice.”
To our knowledge, ours is the only model that can be used to illustrate how the Second Choice option may change the optimal choice at the time of hire. This is a serious limitation in the guidance that has been provided to new employees, and it is an important reason why we developed this tool. It certainly does not represent a forecast of the future, but it can be used to understand the trade-offs inherent in the choices offered in the 2016 tier. Anticipating our main conclusions, they are as follows: 1) an individual who plans to remain at UC for a long career is likely better off in the Pension Choice plan; 2) an individual who expects to leave UC within a few years is likely better off in the Savings Choice plan; and 3) exploiting the Second Choice option allows a new employee to combine the two plans, in effect, by electing Savings Choice early in the career, and then changing to Pension Choice if, a few years in the future, remaining at UC seems like a likely (or more likely) option. For typical settings and assumptions, an individual who remains at UC for an entire career does about as well with the combined option as is the case for the Pension Choice option. This makes the combined option a sensible one for any new employees who initially are not sure they intend to remain at UC for an entire career. They give up less in retirement income and bear less investment risk than would be the case for the individual who decides to remain in the Savings Choice plan. The most important caveat is worth restating: every statement about these plans depends in part on the rate of return earned on individual balances, which in turn will depend on uncertain future outcomes about investment choices that vary from person to person. To add emphasis to this important caveat: the user could specify a sufficiently high interest rate to cause the simulations for the Savings Choice option to dominate the other options, regardless of other assumptions, or a sufficiently low one for this option to fall well short of the retirement benefit provided by Pension Choice.
The decisions that are modeled here are subject to considerable financial uncertainty, and it is important to stress that these relatively simple models cannot reflect this uncertainty. Key inputs to these decisions include: the length of UC service, trajectory of salary earned at UC, age at retirement, investment returns and inflation. The modeling tools allow users to vary the average level of these key variables, but they do not attempt to reflect the variability of investment returns and inflation over the 37 years of the simulations. Inflation is important because it impacts both investment returns and the real value of UC pension payments since the UC pension payments are not fully indexed for inflation. The “UC COLA” column on the table below shows the distribution of the annual increase in UC pension payments resulting from the history of US inflation shown in the “Inflation” column. Finally, an individual’s willingness to accept increased investment risk from Savings Choice depends on their other assets and family needs. The following table and graph show the extent of historical variability in investment returns.
Annual U.S. Investment Returns and Inflation 1931 – 2020, 80% Stocks, 10% Treasury Bonds, 10% Corporate Bonds
|
|
Inflation |
UC COLA |
Nominal Return |
Real Return |
|
Average |
3.2% |
2.2% |
10.8% |
7.5% |
|
10th PC |
0.3% |
0.3% |
-7.8% |
-11.4% |
|
25th pc |
1.5% |
1.5% |
0.6% |
-1.9% |
|
Median |
2.8% |
2.0% |
13.5% |
9.1% |
|
75th PC |
4.3% |
2.2% |
22.0% |
17.1% |
|
90th |
7.7% |
4.8% |
28.5% |
25.7% |
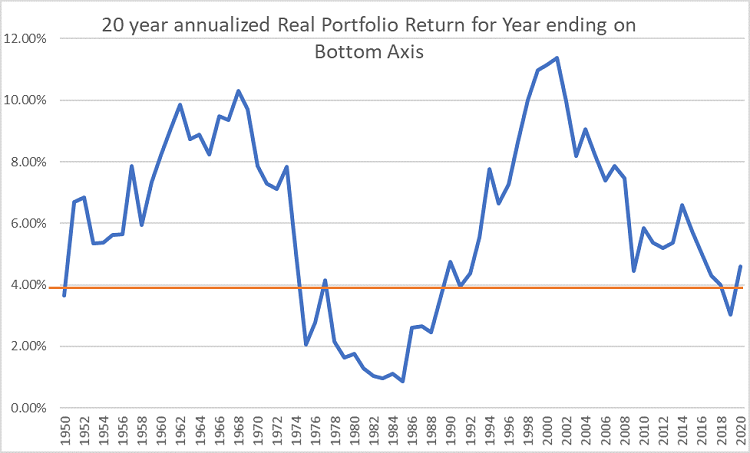
The graph above shows the annualized real return from holding a portfolio consisting of 80% Stocks (S&P 500), 10% Treasury Bonds, and 10% Corporate Bonds for 20 years ending in the year on the bottom axis. The red horizontal line in the above graph corresponds to the 4% real return required for the “4%” rule to hold. This rule says that you can withdraw 4% of a balanced portfolio each year (before taxes but after inflation) without reducing the real value of the portfolio.
The following graph shows the relationship between 20 year annualized nominal investment returns and inflation for periods ending between 1950 and 2020. (Source: http://people.stern.nyu.edu/adamodar/New_Home_Page/datafile/histretSP.html accessed 4/5/2021.)
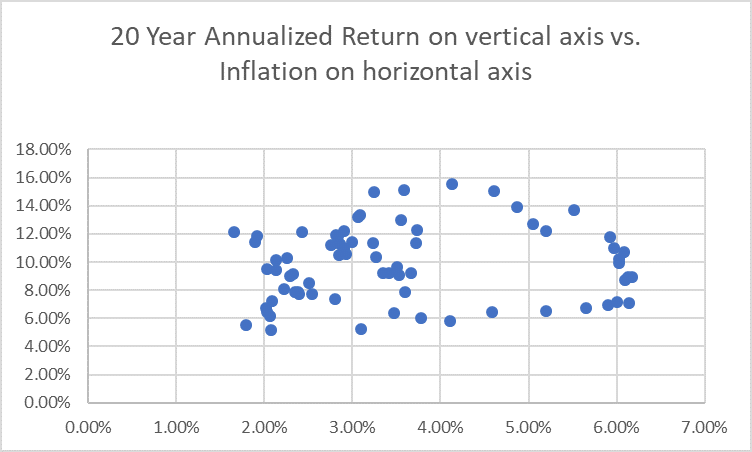
These data show that average historic returns and inflation are above the 6.75% and 2.5% rates assumed by UC in calculating the liabilities of the UC Pension System. These average returns are also higher than the fixed return of 5.25% in the current model available from UCOP-HR. The “UC COLA” column shows the impact of imperfect inflation indexing of the UC pension payouts. UC Pension payments are subject to erosion from inflation whenever inflation is above 2%. Withdrawals and earnings from savings balances are subject to risks from varying investment returns and inflation, and these risks vary with the types and proportion of assets that comprise the savings balance. Inflation risk can be mitigated by moving savings assets into equities and inflation-protected bonds.
The models here also do not account for uncertain lifespan. If you (and your survivor) die shortly after retiring then you will not get much from your UC pension, while the converse is true if you (or your survivor) live longer than expected. Currently the expected lifespan for a 65-year-old retired UC faculty female is 89 years old and 87 years old for males. There is substantial probability of surviving until age 95. The expected lifespan from the Social Security life table for the general U.S. population is 86 years for females and 83 for males.[2]
Pension and savings provide insurance against different risks in retirement. Pensions insure against living too long (exhausting other sources of income), and savings insure against the risk of dying too soon and forfeiting pension payments that could have gone to heirs. Most UC employees will need additional savings to fully replace their UC salary in retirement. The models provided here do not account for those additional savings.
The rest of this document describes the Excel spreadsheet that implements most of our models. The spreadsheet can be downloaded using the link at the bottom of this document. The modeling work was originally done in R and then replicated in Excel to reduce the likelihood of coding errors. The R models are more complete and will be accessible here when they are available. While we have made every effort to reduce errors in producing these tools, we cannot guarantee their accuracy or suitability for every individual.
The main purpose of these models is to calculate the expected retirement income from UC sources for different UC separation dates, retirement dates, investment returns, inflation, and second choice start time. Recall that the election to switch from savings choice to pension choice (Second Choice) must be made between 5 and 10 years of service credit. The Excel spreadsheet assumes that if an employee separates before age 60[3] they wait until 60 to retire, and users can vary this minimum retirement age from 60 to 65. Their savings balances at the date of separation continue to grow according to the assumed investment return rate until age 60 or the retirement date (whichever is later). For all ages past the minimum retirement age, we assume that retirement and separation occur at the same age. We then compute the payout from an annuity that lasts until an age that can be set by the user and grows at the rate of the UC Pension COLA. The interest rate used to compute this annuity payout is the same as the investment return. We do not assume that this annuity can be purchased commercially, but rather this amount represents a reasonable payout that one could expect with a balanced portfolio and average investment return equal to the assumed rate in the model. The expected retirement income from UC sources is just the sum of the UC pension payments and the annuitized savings balance. Users who need their savings balances to last to provide for spouses or other dependents should set a high “Annuity End Age” – at least 110 years.
The model gives the key results as replacement ratios, which are just the ratio of the expected retirement income from UC sources at separation divided by the expected UC salary at the retirement date. If the separation date is before the retirement date, we assume that the savings balances at separation continue to grow at the assumed investment return rate until retirement. The "Projected Annual Income" is the expected annual pension payment plus the annual amount we expect that you can withdraw from your DC savings.
We assume that the initial UC salary grows at the same rate as used by Segal – the actuaries who compute the liabilities of the UC pension system. The “Home_Page” tab on the spreadsheet has boxes in the first 12 rows where users can enter their starting age, starting salary, expected investment rate of return, expected inflation rate, year of UC service when Second Choice election is made (must be between 5 and 10 years), minimum retirement age, and the end age for the annuity based on savings balances. Each time any of these entries are changed users must hit the “Go!” button to update the calculations. Graphs are shown on the Home_Page, and summary tabular results are shown on the “Tabular_Output” page. The “Sheet1” page shows the detailed calculations and the formulas used. Full descriptions of the columns in “Sheet1” are in a separate document (see link below).
For most reasonable values of investment return and inflation the model shows that Savings Choice does better in early years when service credit is low, and Pension Choice does better with higher service credit. Higher rates of return are also more favorable to Savings Choice. Second Choice typically is between Pension and Savings choice, but frequently is not much worse than either of them. Thus Second Choice provides protection against first choosing Pension Choice, then leaving UC employment early with little service credit.
When using the results of this model it is important to consider your family’s composition and financial status. If you have dependents and few resources, then the secure income provided by the UC pension will be important. Conversely if you have substantial other financial assets and few dependents then you may not be as concerned about the investment return risks from Savings Choice.
Links:
- Excel Spreadsheet Tutorial
- TFIR Pension Choice Model.xlsm Clicking this link will download the Excel spreadsheet. Note that macros must be enabled for it to work properly.
- Description of columns on "Sheet1" of TFIR Pension Model spreadsheet.
-------------
[1] There are no retirement benefits provided during the 90-day window for initial choice between options. For even a 25-year career, waiting 90 days represents an approximately one-percent reduction in the pension received at retirement, other things equal, so ideally new employees should be sufficiently informed so that they can make the choice before their first paycheck, as this modeling exercise assumes.
[2] This comparison might cause the user of the program to wonder what happens when an employee dies before retiring. The documents describing the Plan should always be consulted for such questions, but briefly, it is assumed that the individual retired at that point, for purposes of calculating survivor benefits.
[3] We do not model retirements before age 60 because current IRS regulations penalize withdrawals from tax-advantaged savings (e.g. 403B or IRA) before age 59.5.